Liver steatosis, geographic, focal

CASE

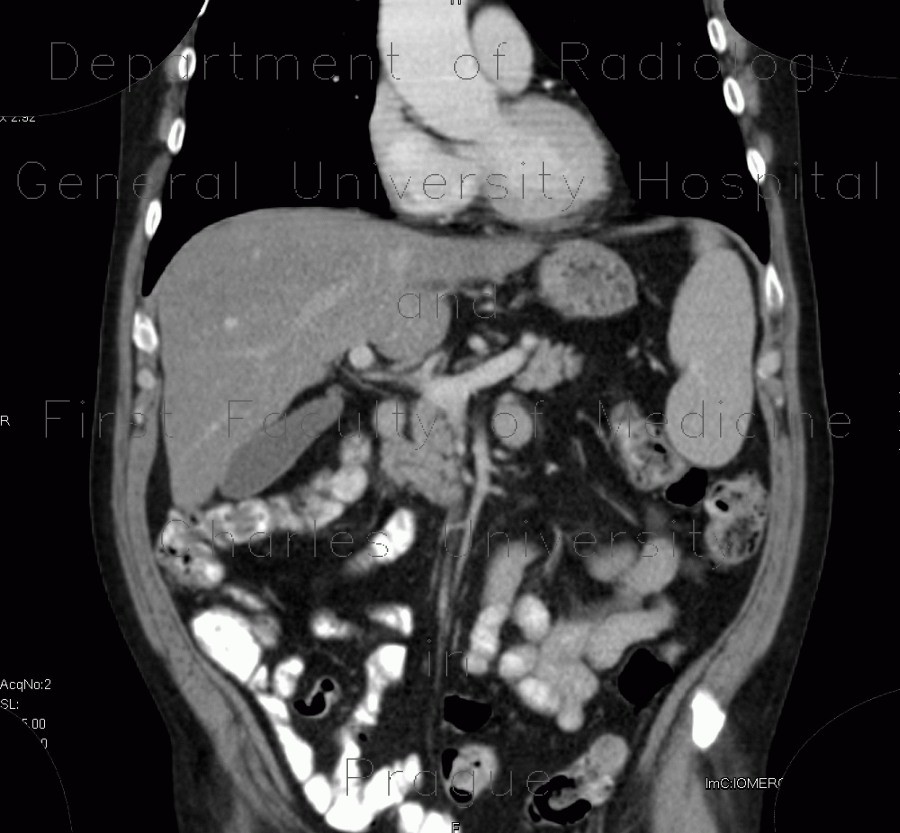
A follow-up CT examination showed geographically decreased density of liver parenchyma with confluent well-defined areas. This finding was further elaborated on MRI, which showed, that these areas are hypointense on T1 weighted images, and more so in the opposed phase. Differences in signal intensity of liver parenchyma on T2 weighted images were subtle. This confirmed the diagnosis of geographic liver statosis. For comparison, previous CT examination showed normal homogeneous density of liver parenchyma in portovenous phase. 

Tags:  Abdomen  Liver
Radiology image - Previous examination with normal liver parenchyma: Abdomen, Liver: CT - Computed tomography

Previous examination with normal liver parenchyma


Previous examination with normal liver parenchyma: CT - Computed tomographyLiver steatosis, geographic, focal: CT - Computed tomographyLiver steatosis, geographic, focal: CT - Computed tomographyLiver steatosis, geographic, focal: CT - Computed tomographyLiver steatosis, geographic, focal: CT - Computed tomographyLiver steatosis, geographic, focal: CT - Computed tomographyLiver steatosis, geographic, focal: CT - Computed tomographyLiver steatosis, geographic, focal: CT - Computed tomographyLiver steatosis, geographic, focal: CT - Computed tomographyLiver steatosis, geographic, focal: MRI - Magnetic Resonance ImagingLiver steatosis, geographic, focal: MRI - Magnetic Resonance ImagingLiver steatosis, geographic, focal: MRI - Magnetic Resonance ImagingLiver steatosis, geographic, focal: MRI - Magnetic Resonance ImagingLiver steatosis, geographic, focal: MRI - Magnetic Resonance ImagingLiver steatosis, geographic, focal: MRI - Magnetic Resonance ImagingLiver steatosis, geographic, focal: MRI - Magnetic Resonance ImagingLiver steatosis, geographic, focal: MRI - Magnetic Resonance ImagingLiver steatosis, geographic, focal: MRI - Magnetic Resonance ImagingLiver steatosis, geographic, focal: MRI - Magnetic Resonance Imaging
lights on off